A horse’s performance is based upon a number of objective and subjective elements. Data allows us to look at sports ability, physiological capacities and fitness, and stride characteristics in a more objective way.
Performance measurement is not a new trend in the sport industry. Long before the emergence of connected solutions and platforms, scientists have encouraged athletes to record data such as the duration, degree of fatigue, day and time of their training sessions in a notebook. By doing so, their progress could be measured through tangible data and not memories. This measurement is important for equine athletes as only the trainer and rider can evaluate a training session based on their sensations and feelings. Strengthening this human expertise through data collection optimizes performance and ensures regular monitoring of each horse’s progress. The history of the data collected supports the management of the performance and health of athletic horses.
On the agenda:
2. Compare horses and tailor training to individual needs
3. Assess the potential of your horses through longitudinal tracking
4. Maximising the chance of success & preparing for a specific race entry
5. Detect the locomotor profile of each horse
6. Detect the warning signs of pathology
1. Detect future performers
To train the future crack winner of Group races is the hope trainers and owners have for each 2-year-old racehorse when he arrives in training. Once trained and in good physical condition, these young horses are ready to do some major work. A standardised test is then used to measure their physiological and speed aptitudes. The data collected during this test has a twofold interest: (i) to detect future performers who stand out from the other 2 years-old by their extraordinary abilities, (ii) to acquire reference data which will then be used as a reference to evaluate the horse’s progress and the effectiveness of the training. This early measurement of performance is a useful tool to save time and assess the horse’s career potential. The data collected during the standardised exercise is then compared to that of a Group horse when he was 2 years old in order to make comparisons and draw conclusions about the horse in question.
2. Compare horses and tailor training to individual needs
In an ideal world, training should be tailor-made to exploit the full potential of each young racehorse. However, in practice, it is impossible for the trainer to train the horses individually. Making comparisons leads to a better knowledge of each horse’s level and needs. The trainer is then able to group horses according to their level or type of distance and can thus adapt the training. A data analysis service enables the performance of the horses to be measured and compared easily and quickly. Keep in mind that only comparisons of similar trainings allow conclusions to be drawn. Therefore, the filter functionalities of the analysis service tools play an important role.
The benefits of individualised training are numerous. The risk of overtraining and undertraining is avoided. By training the horses by level, the risk of injury, especially fatigue fractures, is minimised. The trainer is able to tailor the increase in workload to the individual horse.
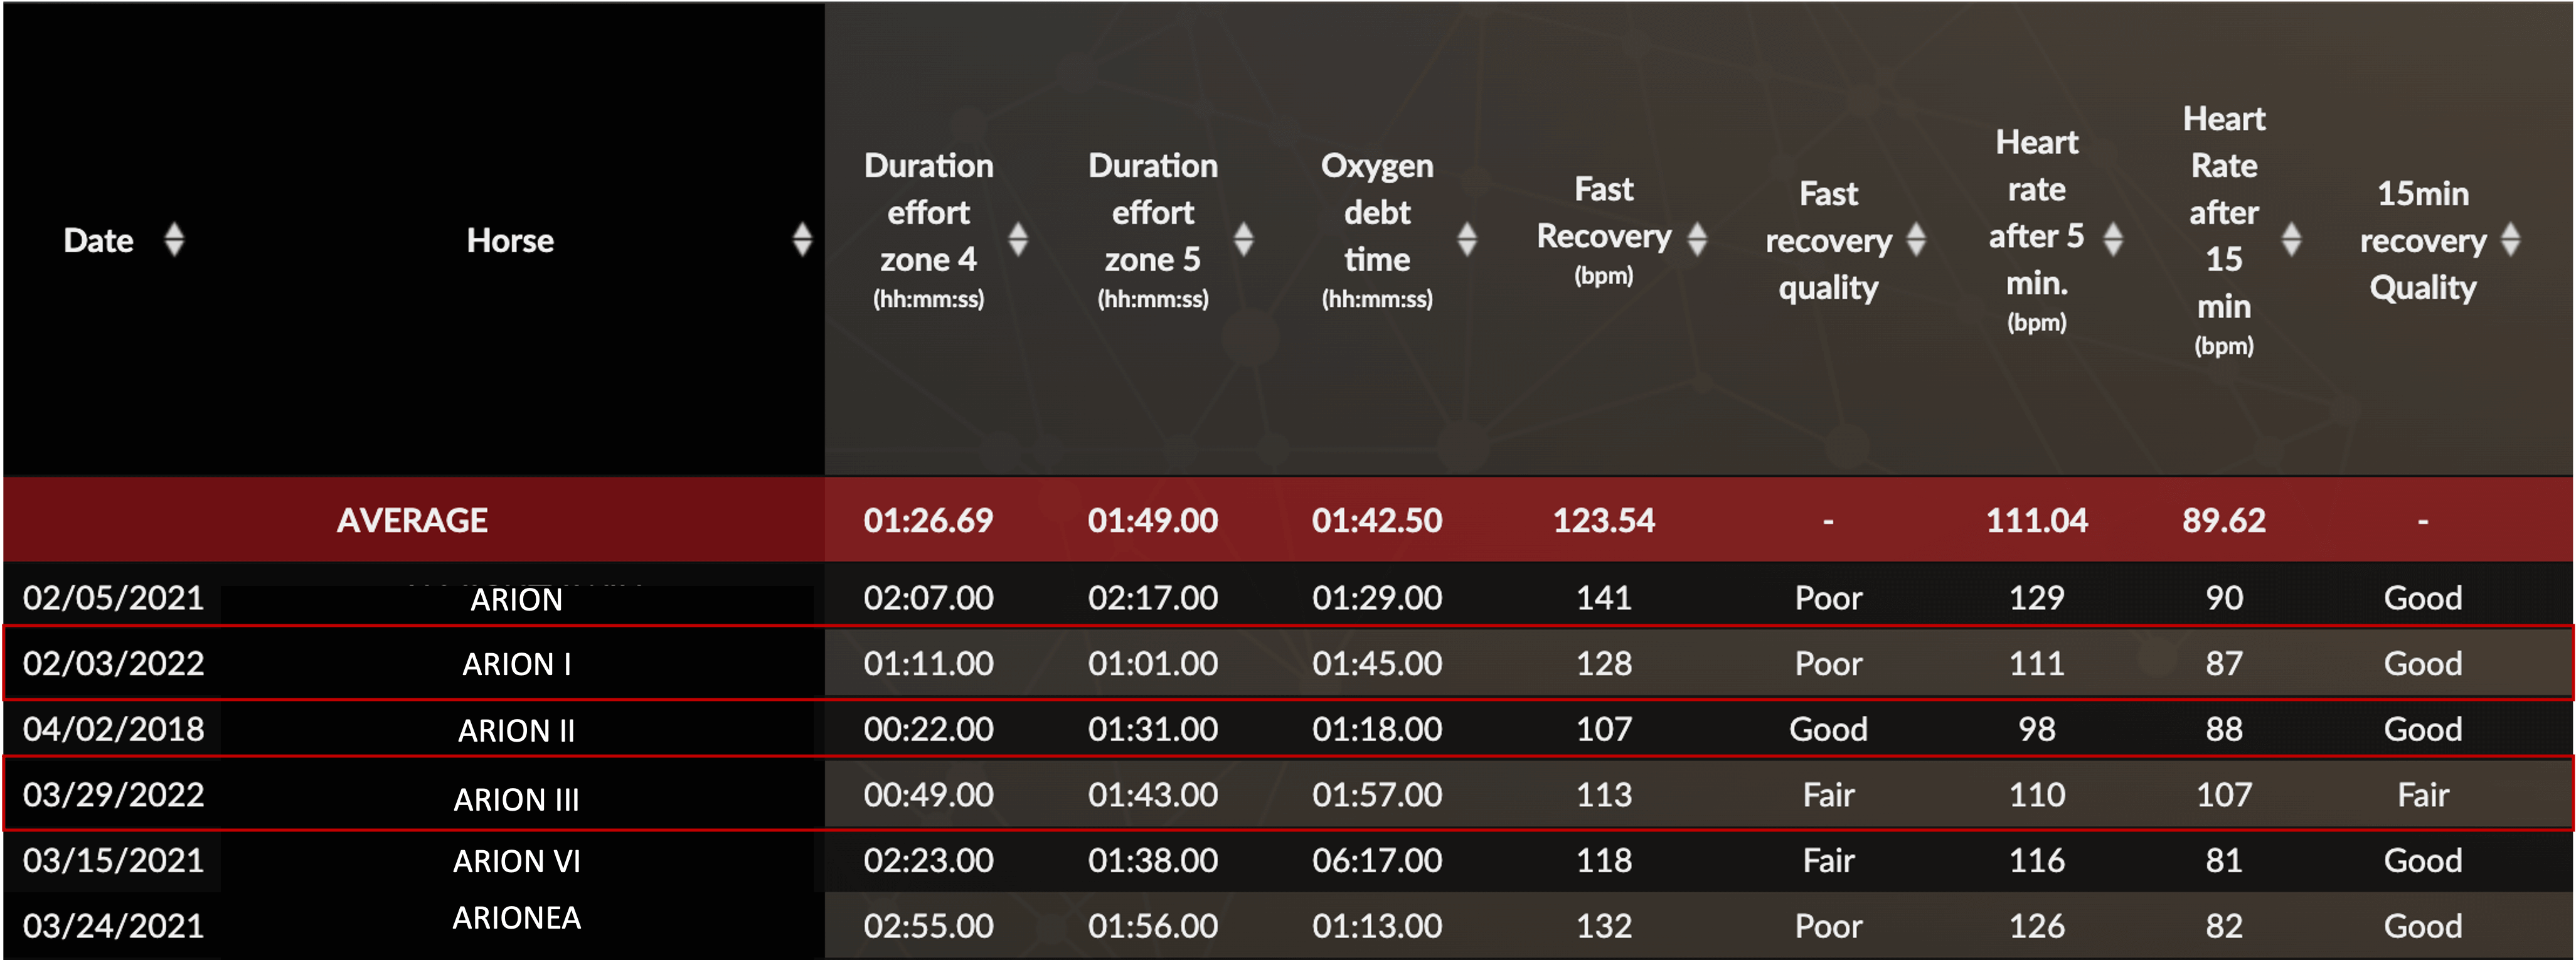
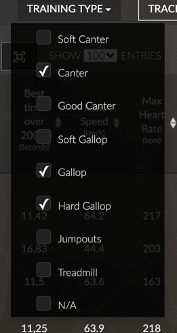
For example, if one wishes to evaluate the first important work of the two years-old in the stable, one selects the type of work (here canter, gallop and hard gallop) and the horses that one wishes to compare. Looking at the table, we notice that some of the horses are already recovering very well, while others need to improve their physical condition.
Data from the Equimetre platform
3. Assess the potential of your horses through longitudinal tracking
The career of a racehorse is known to be short and intense. Assessing potential using longitudinal tracking sharpens the strategic choices that the trainer must make during the horse’s career. The data analysed through a service such as EAP helps to define goals suitable for each individual’s potential.
Thanks to the acquisition of reference data, a horse’s progress is displayed at every part of his training. This defined part is marked by a standardised exercise carried out at the beginning and at the end. It highlights the horse’s progress and allows you to check whether the programmed training is adapted and effective. The data, taken from a standard exercise, is then comparable and relevant.
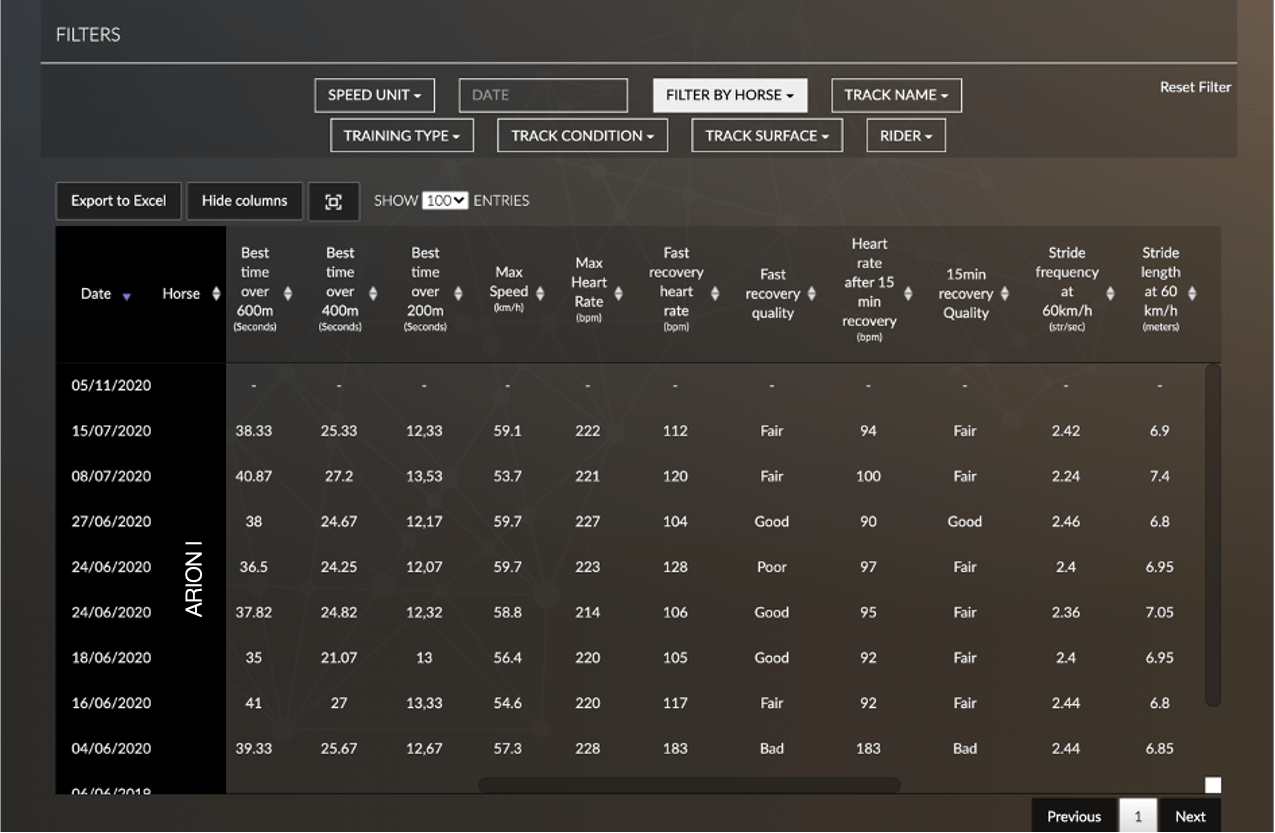
Take the example of ARION I. Using the filter function for each horse, it only displays the horse’s training sessions. We can then see that this horse has progressed between 04/06/20 and 15/07. Indeed, his quick recovery and after 15 minutes improved for a workout reaching about 59 km/h.
Data from the Equimetre platform
4. Maximising the chances of success & preparing for a race
It is no coincidence that most sports are adopting connected solutions and data analysis tools. One of the keys to performance optimisation is the analysis of the large amount of data collected. This tangible data constitutes a history and ensures rational decision-making. It supports the instinct and expertise of sportsmen and women. Bringing a horse to his full potential before a race is one of the ultimate goals of heart rate monitor training. The data collected and analysed by EAP provides unprecedented knowledge of each horse’s abilities, preferences and chances of success. This knowledge supports the trainer’s strategic decisions: is the horse more comfortable on grass or dirt? On sticky or soft ground? When should the final sprint start? The analysis tables help to answer these many questions using objective data.
In addition, by monitoring a horse before a race, reference data is acquired: if the race goes well and the horse wins, the data collected during the last training session will serve as a reference to be reached before the next big race. On the contrary, if the race went badly, the data collected will be a target to be exceeded in order to ensure a better result in the next race.
We are looking here at Arion (anonymized for this paper), a 3 years old thoroughbred who previously raced at the age of two.
Last fall, in her second start ever, Arion achieved a 4th position1,5m off the winner on the aimed race track.
To understand more about her capabilities, the trainer then entered her in a maiden race of 1600m where she finished 3rd.
The targeted chase conditions being 2400m on dirt, Arion then built up a fitness level up to the level of performance needed for the ambitionned race. Here are the parameters calculated with Equimetre:
Data from the Equimetre platform
We can see how the training between those three sessions were successful by looking at the data from Arion. Indeed, due to adequate training, it appears that the overall recovery has improved, as well as fitness and sport abilities. Because training typologies were similar, the common denominator to determine progress is therefore relevant.
5. Detect the locomotor profile of each horse
Are your horses more like sprinters? Milers? Or stayers? The longitudinal monitoring of the data collected using EAP highlights the locomotor profile of your racehorses. This indicator is very valuable as it confirms what is seen with the naked eye: do the length and frequency of the strides really match what is seen in training?
The stride frequency and stride length data is an entry aid for the choice of the running distance. For example, horses with a very fast pace will perform better over short distances because they can accelerate quickly. However, it should be remembered that the horse’s breathing rate is based on the rhythm of his strides. Thus, a fast pace requires a short breathing cycle and is not sustainable for very long. As a result, horses classified as sprinters will be less comfortable over longer distances.
In the example presented, we can think that this horse has a locomotor profile called “Miler”. This profile is characterised by an average stride length and an average stride frequency. We choose here to look at the locomotor data at fixed speed in order to compare effectively from one training to another. This horse will probably be more at ease on medium-distance races.
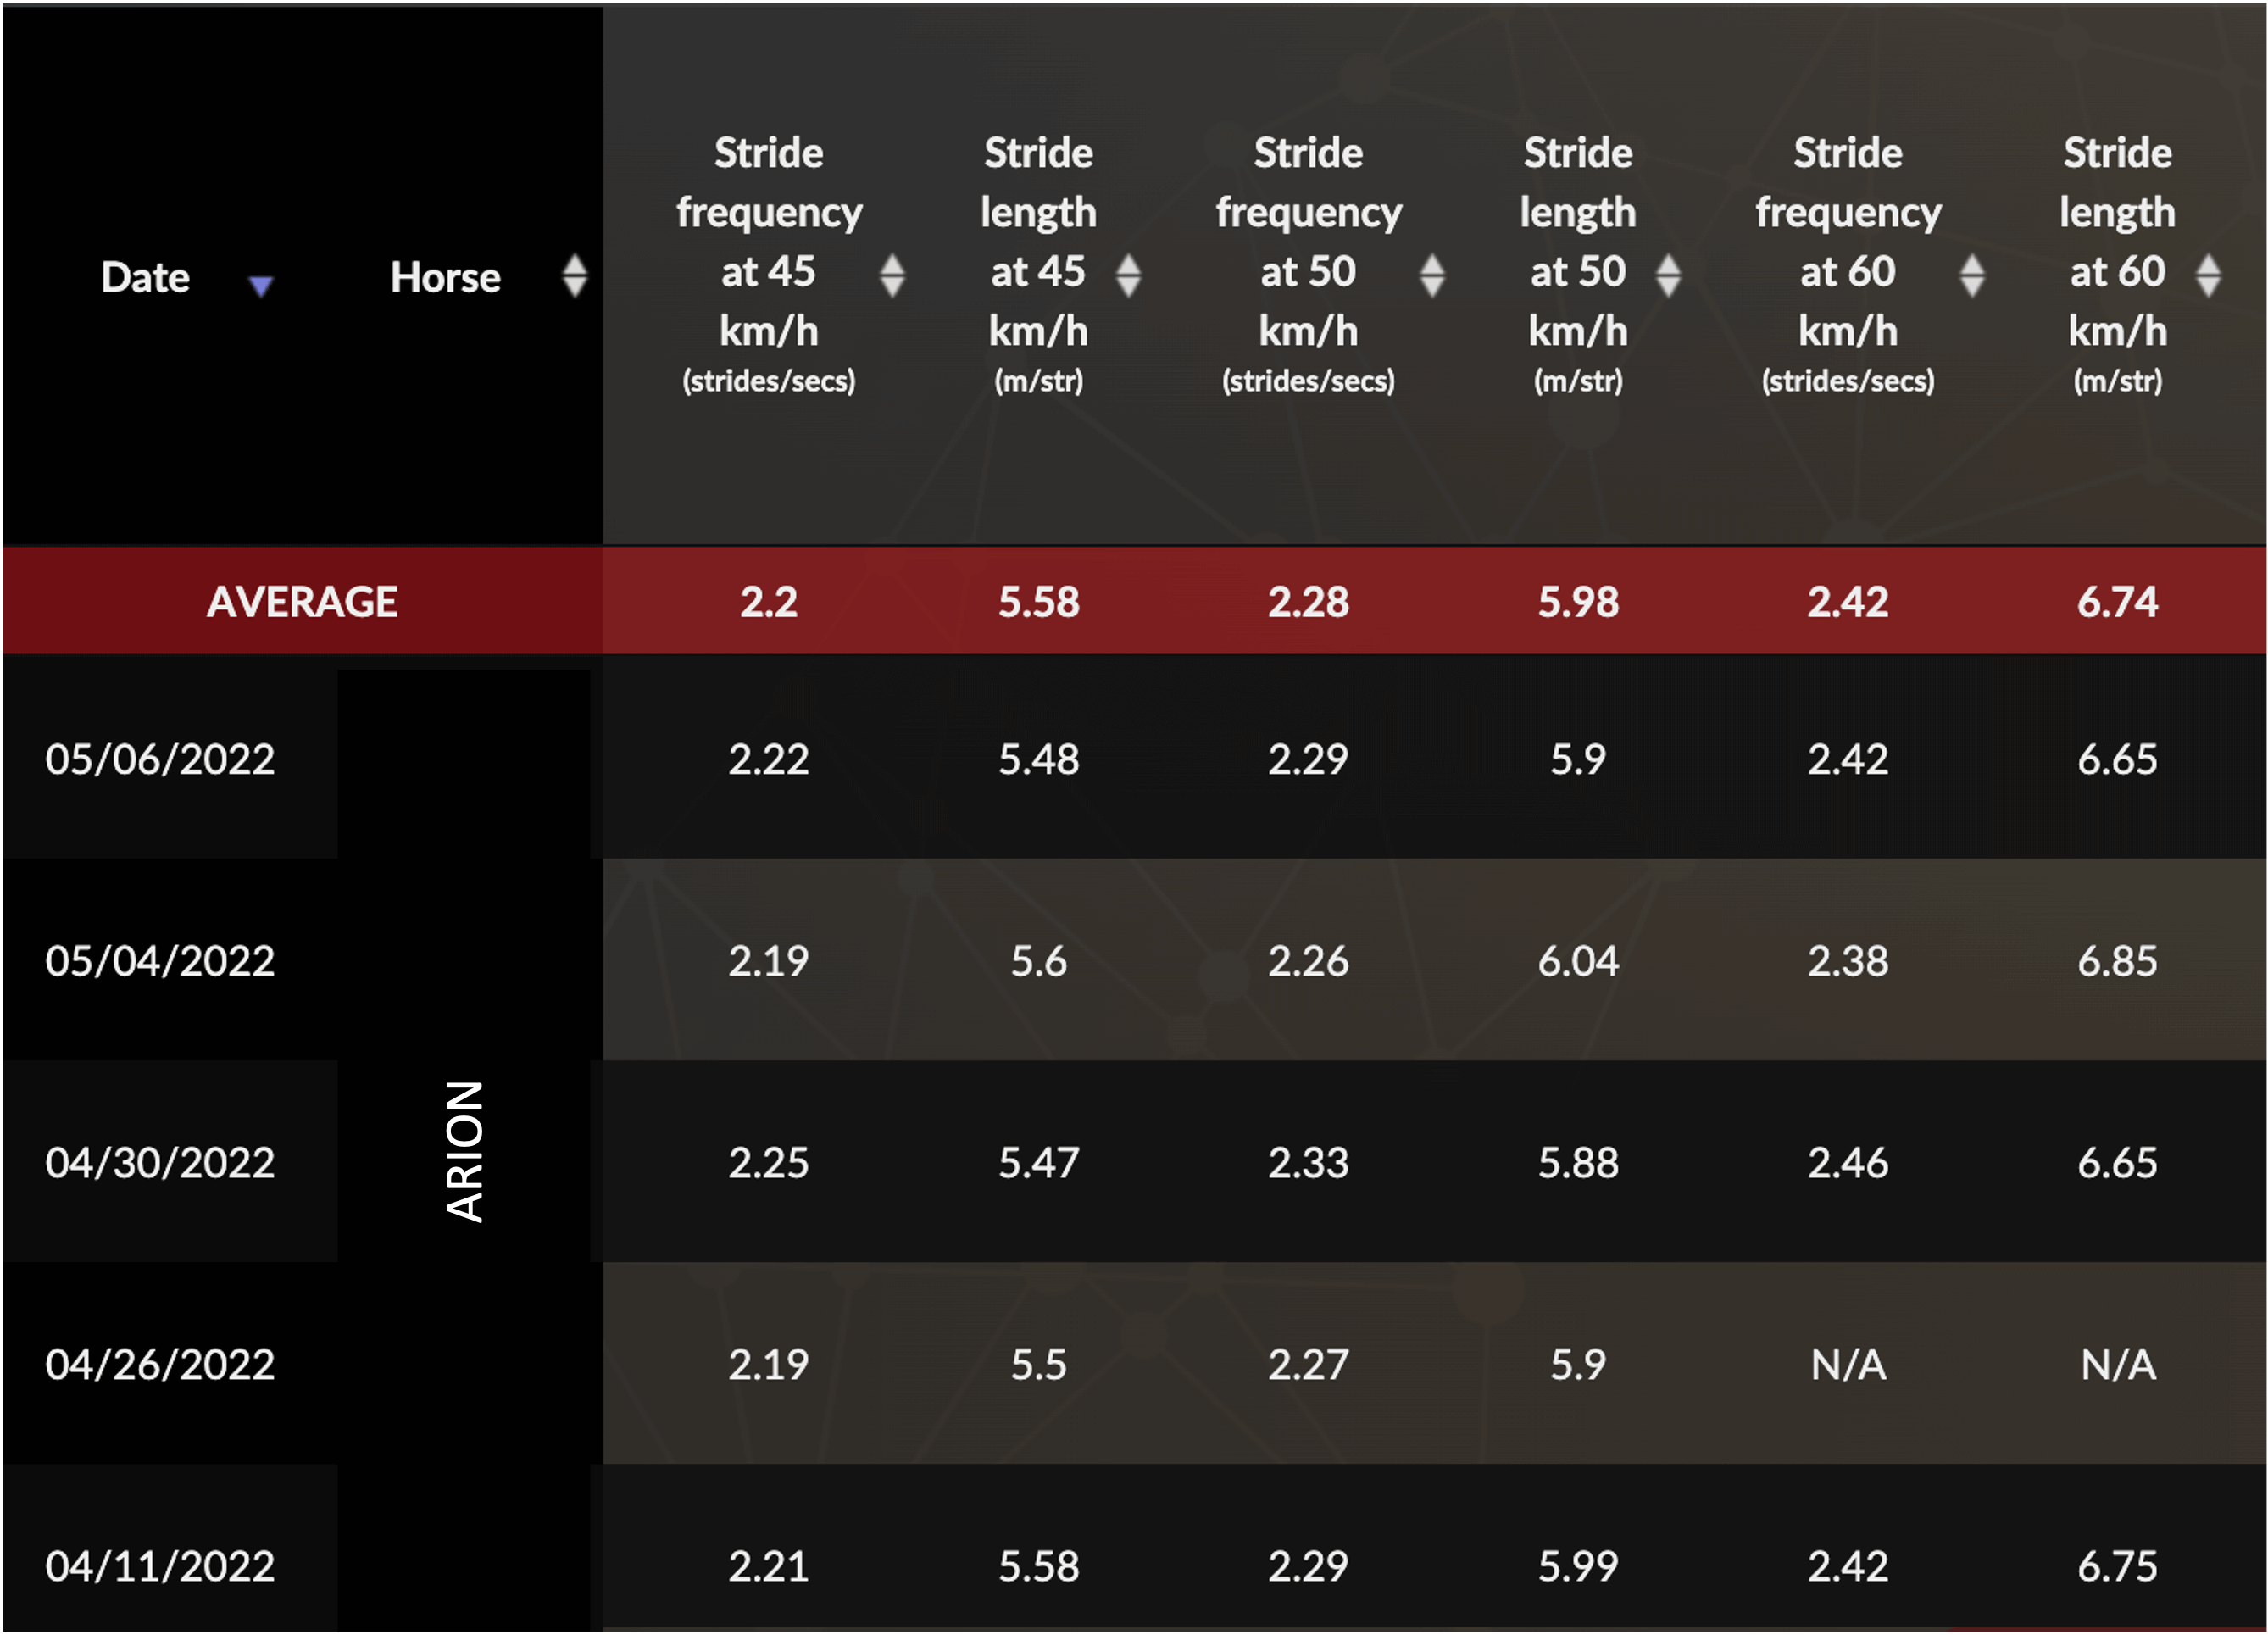
Data from the Equimetre platform
6. Detect the warning signs of a pathology
Data analysis services are a major asset in the detection of early signs of pathology. Indeed, tables such as the one proposed by EAP ensures a longitudinal follow-up of racehorses. In this way, all training data is centralised. Identifying a value above the normal helps to detect an abnormality and to consult one’s veterinarian in a preventive approach. If the investigation reveals a pathology, the problem treated beforehand may turn out to be less serious than it could have been. The parameters to be monitored include: heart rate at first gallop and first trot (if it is abnormally high, it may be synonymous with pain), recovery, speed or locomotion parameters (amplitude, symmetry, regularity).
The use of EAP therefore allows regular monitoring and prevents the risk of injury.
For example, the ARION’s training data show a shorter stride length and a poor recovery. After a vet examination, a high suspensories issue was detected and ARION was treated with shock waves on the 11th of March 2020.

Data from the Equimetre platform
7. Follow up on a horse during treatment
Outside of a clinic, the veterinarian cannot follow a horse daily during treatment. Once the horse has been diagnosed, the veterinarian will recommend treatment and schedule a follow-up visit after a defined period of time. Collecting data on the diagnosed horse during the treatment period allows to monitor the horse’s adaptation to the treatment as well as its effectiveness. Corrections can be made. Veterinarians can refine the diagnosis and monitor the horse remotely, via the data centralised by the EAP platform. The trainer is able to detect abnormalities and consult the veterinarian if necessary.
If I diagnose a heart condition on a racehorse, it is important to me for the management of its career and the safety of its rider to follow how it evolves with its condition. Today, depending on the heart problem diagnosed, we can decide to see a horse again within 6 months. But if I have a sensor that I can put on this horse in training during these 6 months, I can objectively evaluate if his physical condition is evolving well. On the contrary, I can see if a different treatment or training needs to be put in place. This allows us to be really more precise and reactive in our interventions.
8. Go back to work after an injury
No horse is safe from the risk of injury. When a racehorse is injured, his career is put on hold while he recovers. In order to best manage his return to work and to bring him to the maximum of his abilities as quickly as possible without taking any risks, a tool such as EAP is an asset. Indeed, the analysis software centralises the data of the same horse before and after his injury. The history of the data combined with the advice of the veterinarian helps the trainer to gradually measure the increase in workload without skipping steps. Finally, we monitor the appearance of pain (high heart rate during warm-up for example) or lameness invisible to the naked eye (thanks to the monitoring of the symmetry and regularity index).
EQUIMETRE ANALYTICS PREMIUM – Going further with data analysis
EQUIMETRE ANAYTICS PREMIUM gives the possibility to carry out a finer and more thorough analysis of the collected data. The goal is to make comparisons between the horses in the stable but also between the different trainings of the same horse. The multiple filter functions simplify the analysis: choose the date range, the horses, the parameters to be monitored, the type of training etc. Having an analysis service such as EQUIMETRE Analytics Premium ensures a complete follow-up of the performance measurement within a stable. The tool displays the evolution of each horse while facilitating the identification of the areas to be worked on.
Keywords: EAP, horse performance measurement, future performers, longitudinal tracking, locomotor profile, pathology, individualize training

