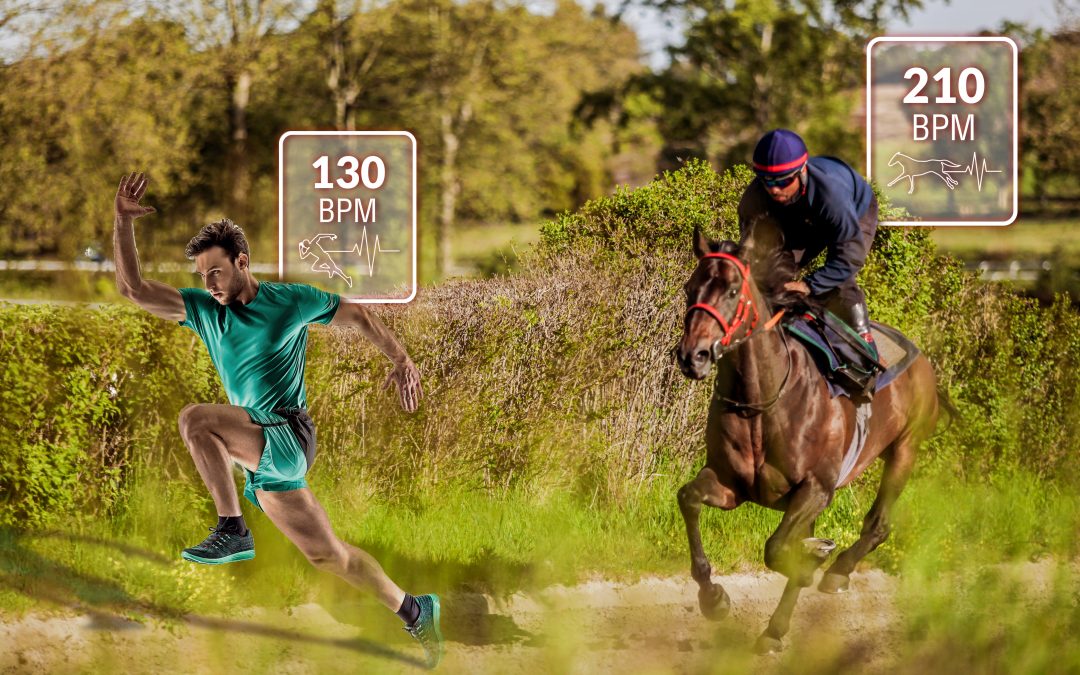
Since 2007, data has spread in the high-level sports industry: tracking systems in all NBA (National Basketball Association) stadiums, sensors utilization during rugby training, essential parameters analysis for soccer recruitment… Today, many professional sport clubs use new technologies to improve their decision-making and their teams’ performance. For example, data support the training individualization by helping to identify the needs of each athlete. Trainers can then adapt workouts and training programs. In addition, the emergence of new technologies can help limit the injury risk. These benefits are significant for a sector as demanding as the horse racing industry. In this article, we compare the training between the racehorse and the running athlete to understand how data to integrate data in the racehorses’ training.
So why shouldn’t the horse racing industry use data into their daily lives?
1. What is a typical training week for high-level athletes?
Running athletes training schedule
As no general truth exists, we identified a training structure similar to top-level running athletes: 3 weeks of work and then a less intense week, with 3 to 4 workouts per week.
Example – Typical week for a runner who wants to run a marathon
|
Exercise type |
Details | |
| Session 1 |
Running speed |
20 minutes of endurance followed by 3 times 2 km of running speed (with 2 minutes of recovery between each times) followed by 10 minutes of recovery |
| Session 2 |
Endurance work |
45 minutes to 1 hour of endurance (with a muscle strengthening session) |
| Session 3 |
MAS work |
20 minutes of endurance followed by 8 times 400 meters at the MAS* (interspersed with a 200 m recovery) |
| Session 4 |
Endurance work |
1 to 1.5 hours of endurance training, with change in the duration depending on the week |
Maximal aerobic speed (MAS)
The maximal aerobic speed (MAS), expressed in km/h, is the speed at which you reach your maximum oxygen consumption.
Racehorses’ training schedule
Racehorses are trained daily in lots, early in the morning. Trainers choose these lots according to different criteria:
- The character
- The level and age
- The strengths and weaknesses to work on
- The training type
These criteria can change from one trainer to another. For example, a flat training session lasts about 1 hour in France compared to 20 minutes in Australia. The week before a race is generally less intense, and the last exercise takes place 2 to 3 days before the race.
Running athletes and racehorses: relatively similar training programs
For both types of athletes, the search for performance rules their training program. It evolves according to deadlines and involves different exercises (endurance, acceleration, recovery, etc.). Both disciplines require high-intensity training.
However, there are some differences between the two disciplines. Indeed, the horse needs a routine. In addition, unlike a human athlete, horses are not able to communicate. It is therefore essential to watch for any signs of fatigue or injury. Finally, a running athlete’s intense sessions will not be daily, as they do not have to train to get an acceptable daily dose of physical activity.
Although there are some differences between the two disciplines, the comparison is still relevant.
2. What are the performance indicators to track for these athletes?
Running athlete performance indicators
Thanks to the sports technologies development, it is now easy to collect a range of data during human sports training. Here are some indicators to monitor:
- The speed
- The heart rate
- The VO2 max
- The elevation gain
- The stride frequency
- The distance covered
- The different effort zones
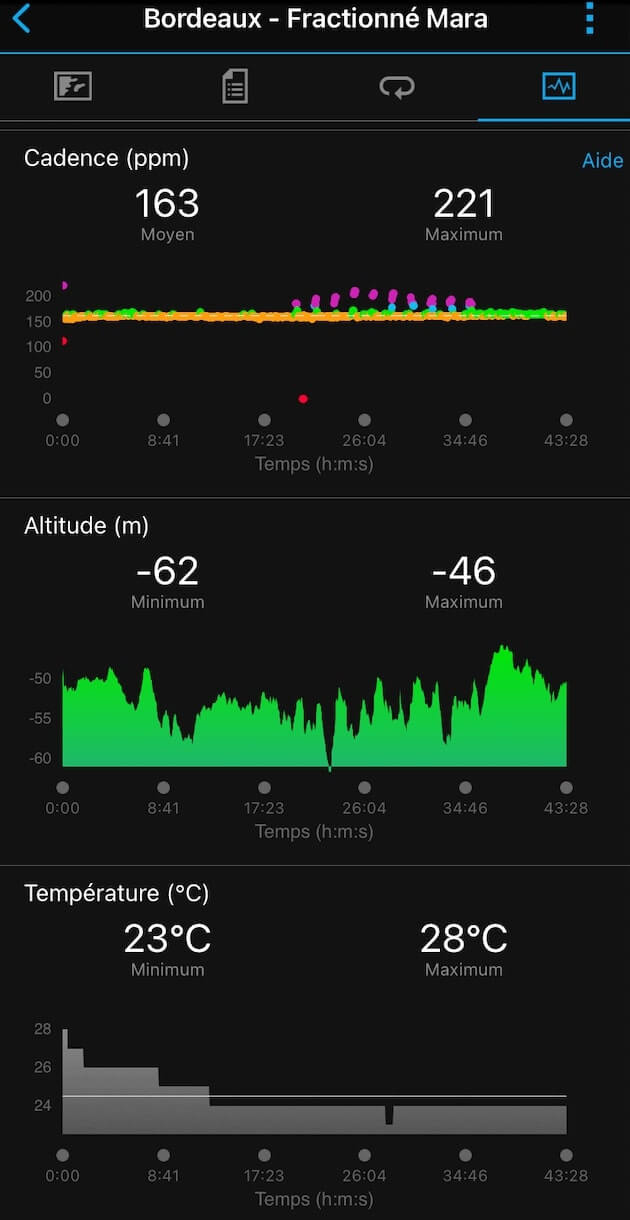
Exemple – A split training recorded on the Garmin platform
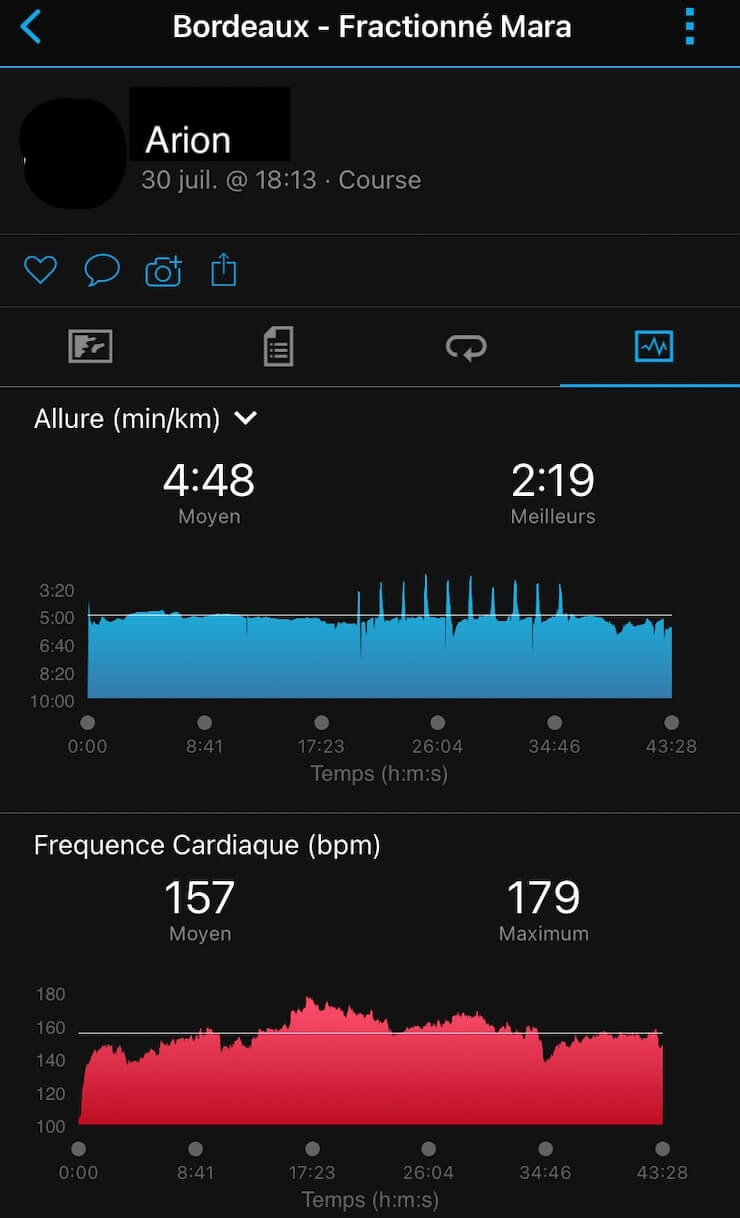
It starts with a 20-minute warm-up, then ten times 30 seconds of acceleration (with one minute of recovery between each), and ends with ten recovery minutes.
We see an acceleration of the stride frequency to 220 steps/min according to the acceleration of the speed (purple dots). Usually, the data indicate that the average stride frequency (noticeable in orange) is around 160 steps/min. The athlete is using his stride frequency and not his stride length to accelerate.
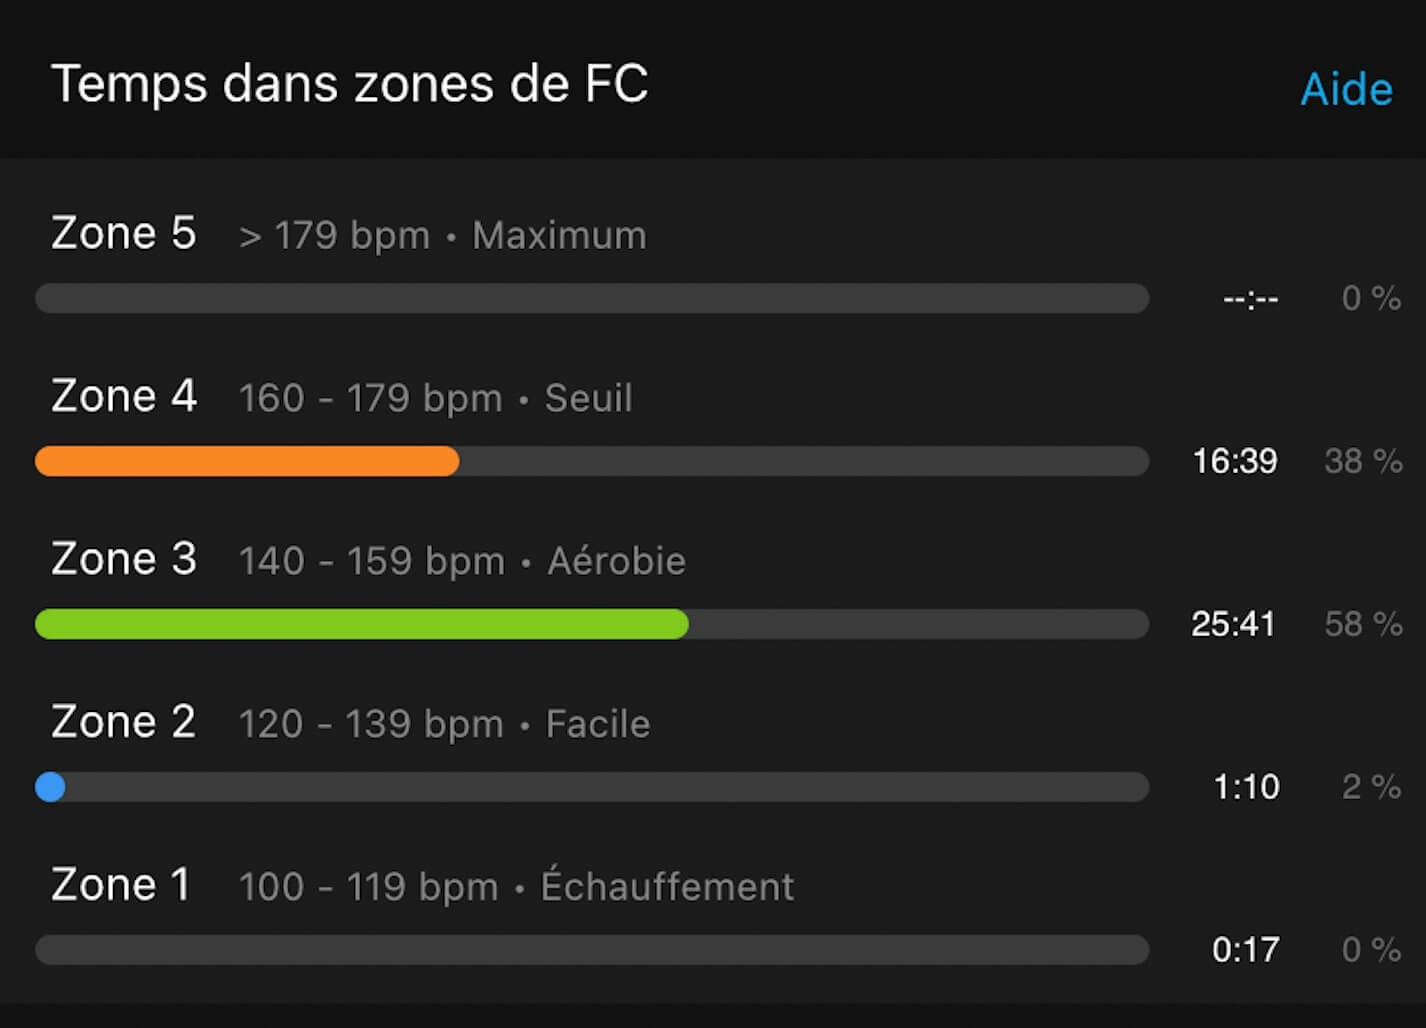
The heart rate increases at the beginning of the exercise (reaching 179 bpm during the intense effort) but does not come down during the recovery times. As these are very short, they are not sufficient to bring the heart rate back to its initial level. The final recovery phase is efficient as the heart rate decreases. Data show that almost 50% of the training was in zone 4. It is because the heart rate did not decrease during the recovery phases.

Racehorse’s performance indicators
The arrival of new equine technologies (such as EQUIMETRE) makes it possible to collect data during training.
Here are the key parameters to measure during a session:
- The speed to quantify physical abilities.
- The heart rate to assess fitness.
- The stride frequency (in strides per second).
- The stride length is the size of the stride (in meters/stride).
- The different effort zones – to evaluate recovery.
Example – Training data from a flat racehorse in France
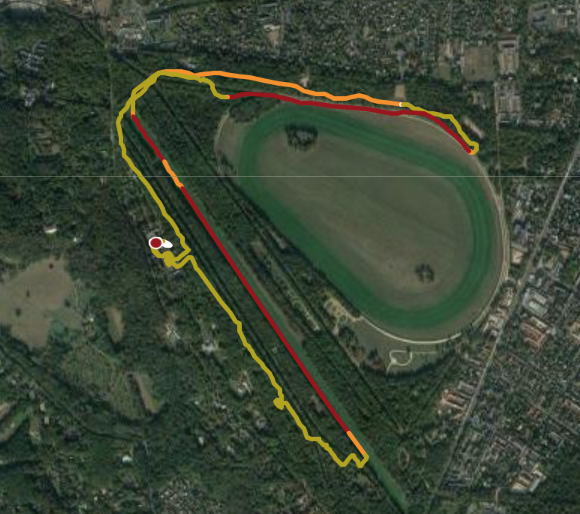
This training consists of about twenty minutes of warm-up (walk, trot, and hunting gallop). Then, the horse starts on a straight acceleration line at a gallop reaching 60 km/h.

Heart rate decreases as speed decreases. It indicates a good recovery from this horse.
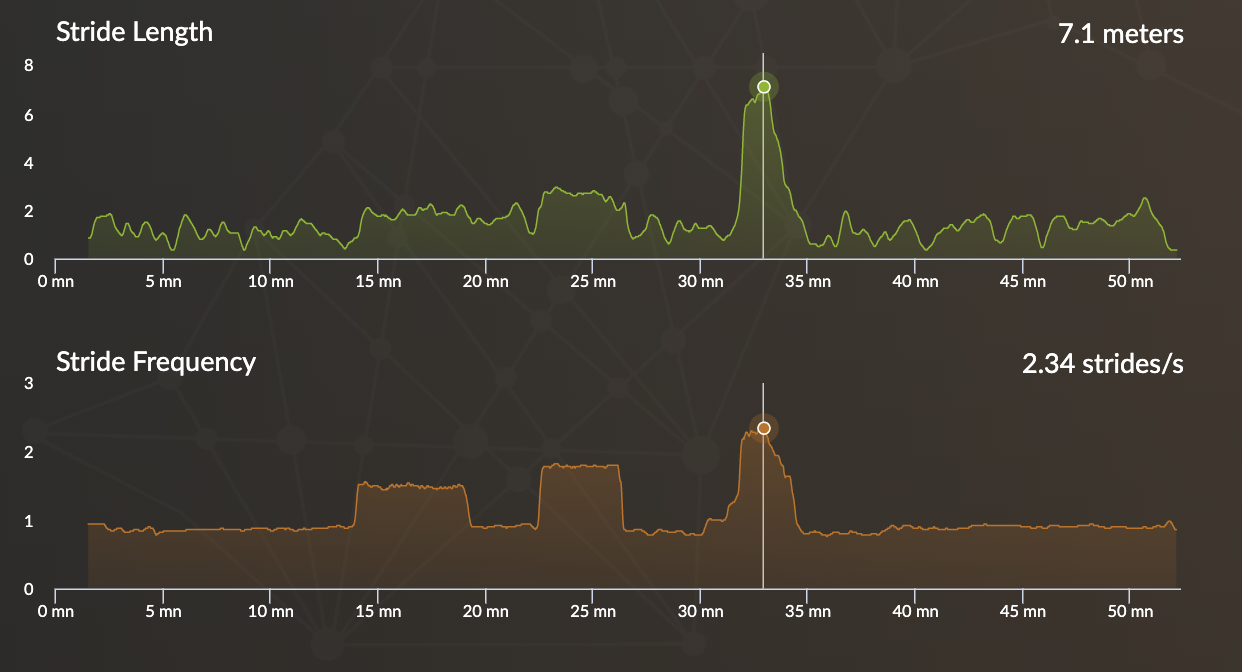
The stride length and frequency data provide an objective quantification of the horse’s stride. We observe that this horse has a great stride length and a low stride frequency. From this analysis, we can identify his locomotor profile and his theoretical running distance.
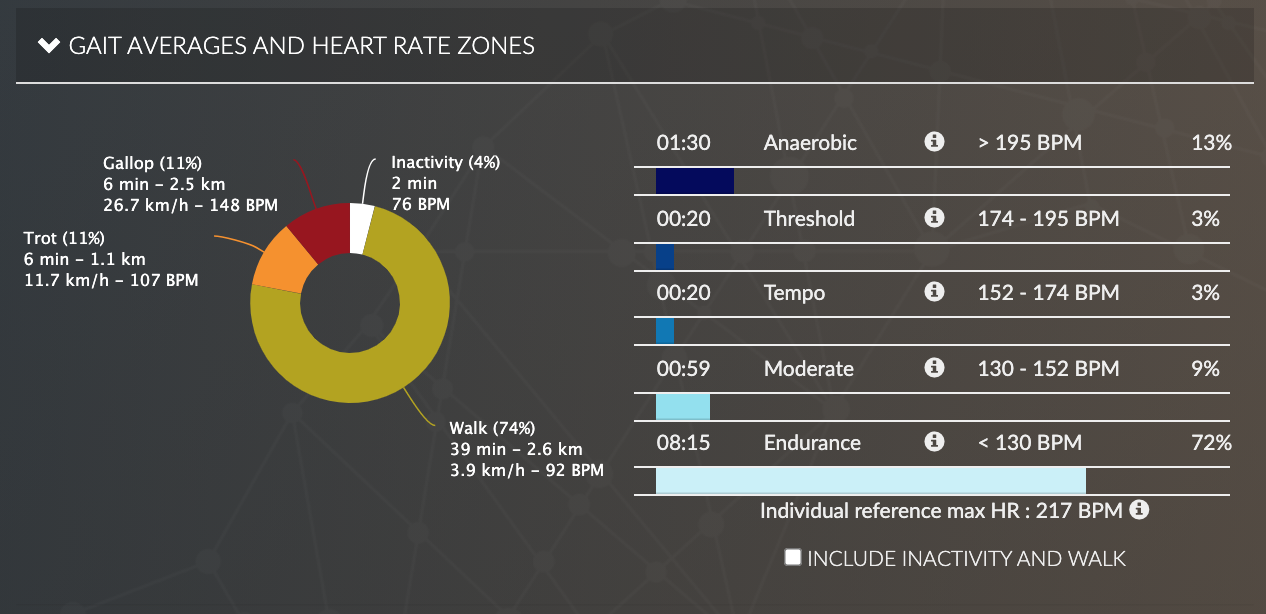
Finally, the data shows that the horse has been working in the anaerobic zone. He pushes his MAS threshold, he can run faster and longer without producing lactic acid.
This data is a valuable help for the trainer. It can keep a history of each horse’s performance over time and offer the possibility of taking a fresh look at training.

Common performance indicators
Although they do not practice the same sport, these two athletes have a significant common interest to collect data.
Table comparing the values of these two workouts
| Running |
Horse racing |
|
| Training duration | 43 minutes | 52 minutes |
| Maximum speed reached | 25,9 km/h | 60 km/h |
| Maximum heart rate | 179 bpm | 210 bpm |
| Maximum heart length | N.A. | 7,2 meters |
| Maximum stride frequency | 221 steps/minute (= 3.68 steps/second) |
2.38 strides/second |
These two disciplines have similarities in the athletes’ performances analysis. The main difference is the method divergence used to increase speed. Humans generally use stride frequency to increase speed. Increasing the stride length would generate tensions and could be bad for the joints due to the change of the gravity center. The horse’s method of acceleration is specific to each horse according to his locomotor profile.
3. The role of data in the search for high performance
Quantifying training provides many advantages, both for human and equine athletes. Data allows an objective evaluation of the progress over time. It makes it also possible to compare with the other horses in the stable.

Data from the EQUIMETRE platform
The data above shows the horse’s recovery improvement between March and August. This analysis method is widespread among runners. Indeed, athletes have similar comparison tools to measure their performance evolution.
Moreover, the detection and prevention of pathologies is a challenge that new technologies can address. A horse can hardly show his pain when it is not locomotor. Data is a tool to detect alarming signs. Similarly, it allows us to monitor the fatigue level to find the balance between under-training and over-training. Finally, trainers can identify future performers. Good recovery capacities after the effort at the beginning of their career is a sign.
4. Data: a relevant solution for the horse racing industry
In conclusion, the quantification of training accompanies high-level athletes, whether human or equine. Data offers a better understanding and listening of the athlete. The tracking system inaugurated in October 2019 during the Prix de l’Arc de Triomphe shows the new technologies spread within the racing industry. This trend would therefore benefit from being followed in the training of racehorses. Today, monitoring is still a competitive advantage for racehorse trainers. It aspires to become a standard as it has become in other sports. Its arrival will maybe help to purchase young horses or improve the accessibility of betting on the racetrack.
Keywords: comparison, running, race horses, training, data, sport, future, racehorse running athlete